Health Tracker
Analysis for my health data such as Water and Caffeine intake, Heart Rate, Steps, and Sleep.
See other pages:
Created: 05/21/2021.
Languages and libraries used: python, pandas, matplotlib, and numpy
All data is collected using Apple Watch (Apple Health) and Sleep++.
Sleep
Sleep data was collected starting End of Jan 2021 until now.
Sleep is logged in 3 categories:
- Restful sleep: When the body is at rest when asleep.
- Restless sleep: When the body is restless when asleep (can be movement, etc.)
- Awake minutes: When the body is almost or completely awake during sleep start and sleep end time (as awake movements, etc.)
Quality of sleep
Starting out with the graph which I found most interesting due to its implication: Quality of sleep against the duration of sleep. Quality is measured using restful_sleep*100/total_sleep. The red trendline is a polynomial degree 1 LOESS curve.
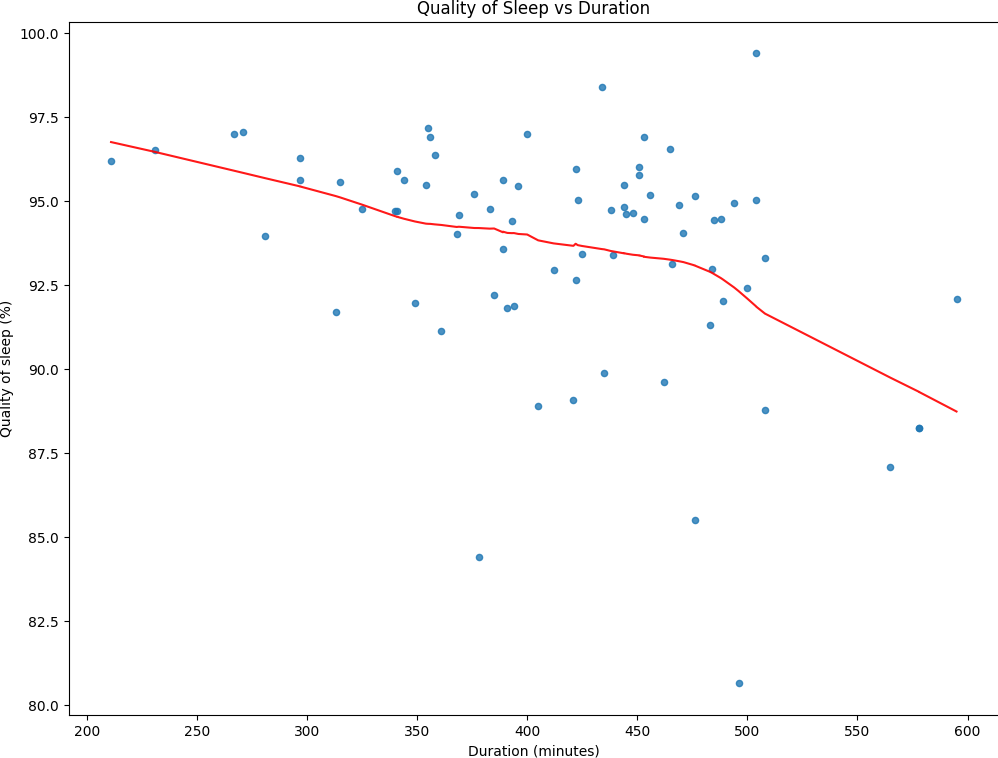
I found this graph the most interesting as a negative slope of the line of regression implies an inverse relationship between duration and sleep. Correlation is not causation but a hypothesis could be restlessness increases after the regular sleep duration as the body tries to push the body clock. However, no conclusion can be drawn from simply this data as various factors such as alcohol, caffeine, water, etc. intakes are not considered. Nor are things such as stress or activities on that day.
Duration of sleep
A histogram of the total duration of sleep using 20 bins. The total duration of sleep is the sum of restful sleep, restless sleep, and awake minutes.
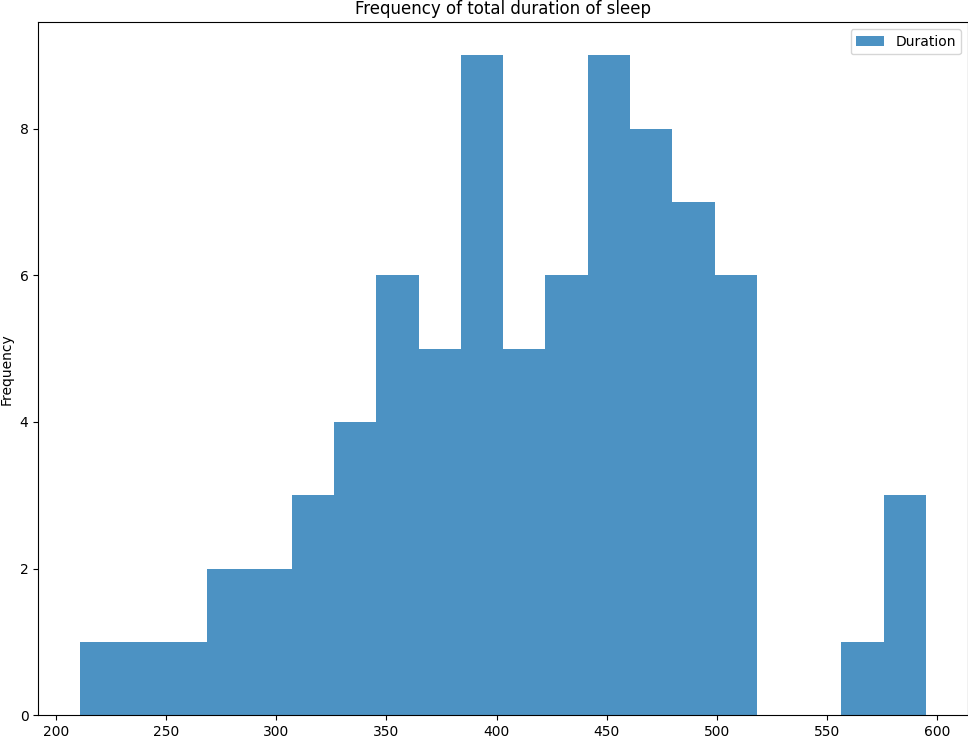
There are outliers when sleep is around 250 min (~4.2 hours). These known instances happened during my finals or midterms during the Spring 2021 semester.
The average duration of sleep was 417.3037 min or ~6.96 hours. And, duration is concentrated around 400 min (~6.67 hours) to around 500 min (~8.33 hours). Since my goal for sleep was around 420 min (7 hours) during my undergraduate, results were as expected.
There are also 4 days where I slept for more than 540 min (9 hours). All of which happen to fall during the week of 02/14 when the snowstorm hit Texas and the university extended the spring break for another week.
Start time for sleep
Scatter plot of the start time of sleep in 24-hour clock format. For a better representation, I have removed the data points from [07:00, 18:00] as they were all zeros.
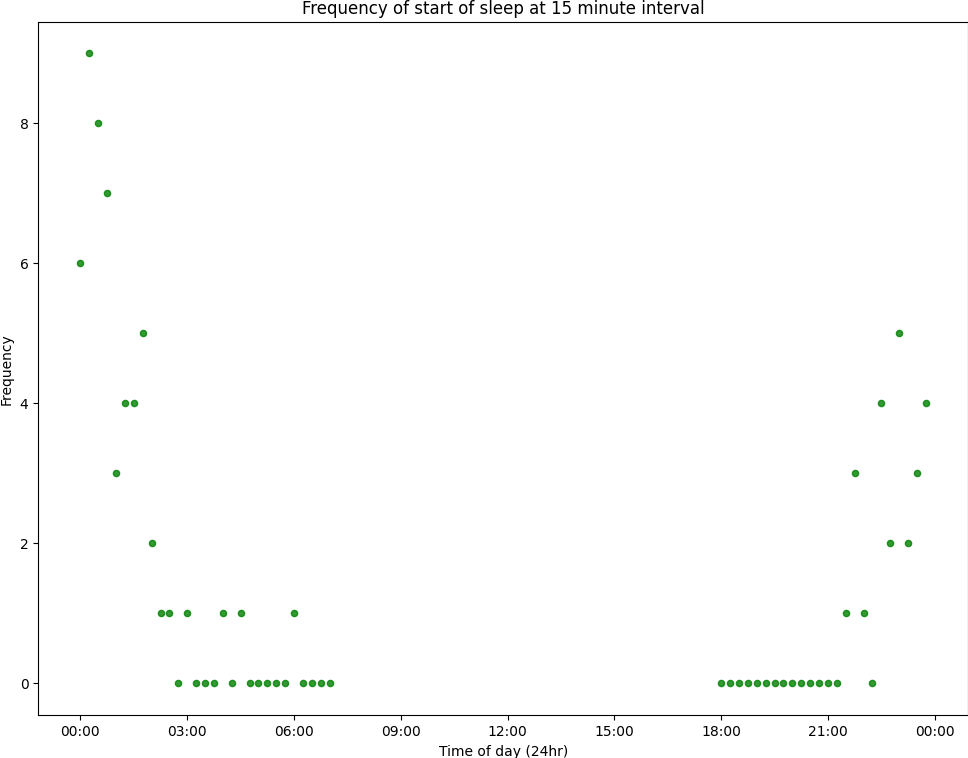
The outliers of start time beyond 3 AM (even 6 AM) are very noticeable right off the bat. These are known instances as they occurred during the finals week of the Spring 2021 semester on the days of various finals as I stayed up late to study.
Apart from those, another noticeable area is right after midnight (00:00). Usually, I tend to wrap things up as it hit midnight and call it a day (I know, it is already the next day). The rest of the points seem to fall between 1 to 3 AM and in almost a reflection of that at 10 PM to 00 AM.
End time for sleep
Scatter plot of the end time of sleep in 24-hour clock format.
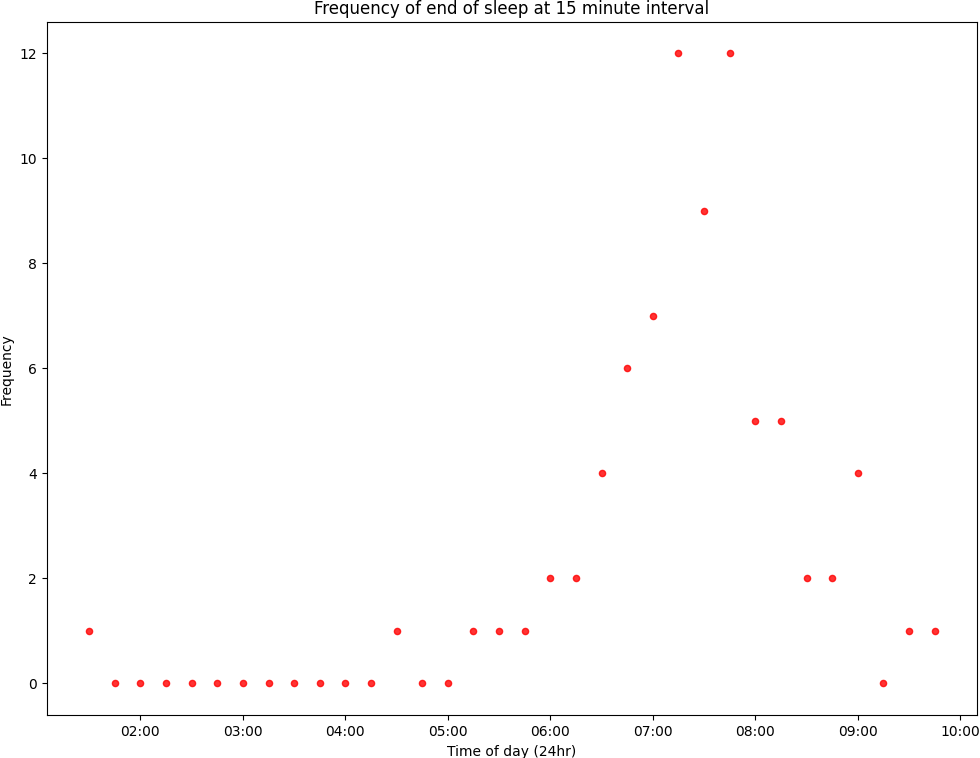
Times of the end of sleep seem to be more consistent (than the start of sleep) garnering much higher frequencies, especially during the short interval of 7 to 8 AM. Probably due to the body clock which tends to wake the body up at regular times regardless of when one fell asleep.
A few oddities are when I woke up as early as 2 AM and a few times around 5 AM. These mostly occurred during the finals or midterm of the Spring 2021 semester. There are also a few days where I woke up after 9 AM but never exceeded 10 AM. Since the alarm is set at 9 AM every day, despite a couple of snoozes I tend to wake up soon hence such a result was expected.
Days of the week
Horizontal bar graph of average sleep duration over week days.
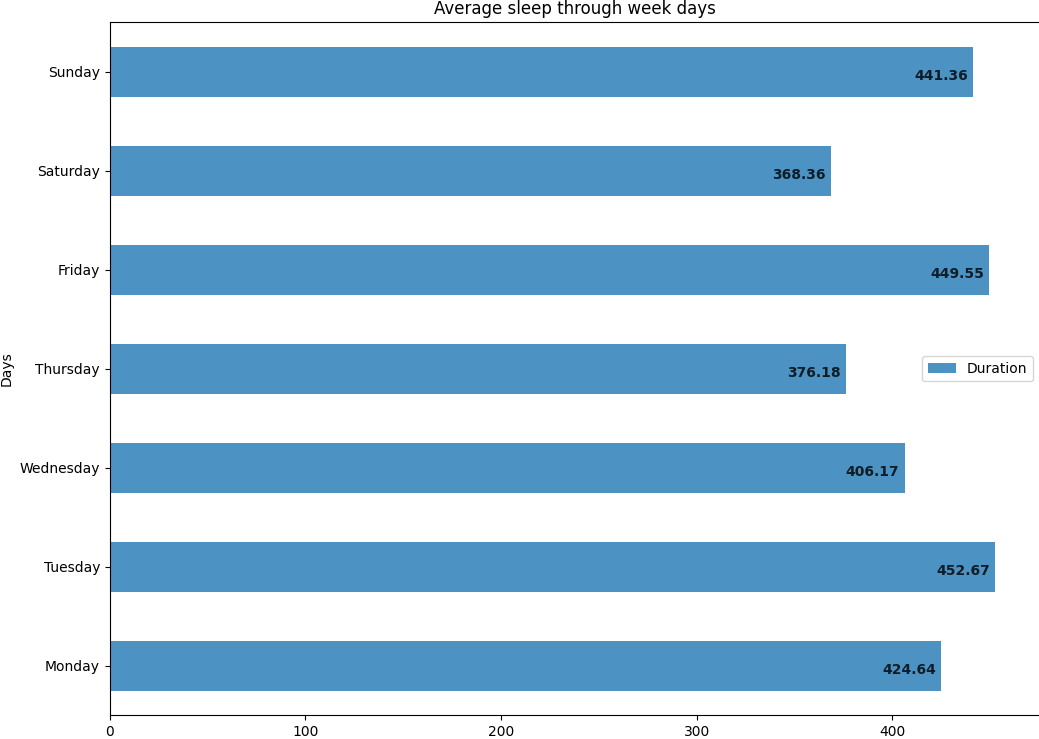
Among weekdays, Thursdays seem to have the lowest average sleep duration. This could be due to two reasons. Firstly, an early biology class on Friday cutting at sleep. But more likely because a lot of things were due on Fridays such as quizzes, assignments, labs, and senior design dues. Since I tend to polish and finalize everything on Thursday, sleep duration is lower despite assignments being due on Friday.
As expected, Saturdays have the lowest average among all days. This is likely because I tend to hang out with friends, watch movies, etc. much more on Saturdays than Sundays or any other day.
Since Tuesdays and Wednesdays were the least busy days Spring 2021 semester, Tuesdays have the highest average. There is also a downward trend once the week starts picking back up at the weekend.