Health Tracker
Analysis for my health data such as Water and Caffeine intake, Heart Rate, Steps, and Sleep.
See other pages:
Created: 05/21/2021.
Languages and libraries used: python, pandas, matplotlib, and numpy
All data is collected using iPhone and Apple Watch (Apple Health).
Steps
Data points for January 2021 are removed. As I became used to the watch, I stopped carrying my phone around. But, during January 2021, I stopped wearing the watch; But, because of the habit of not carrying the phone around very little data was registered for days in that month.
Average steps hourly
Average steps were taken during hours of a day. These are averages of recorded non-zero steps.
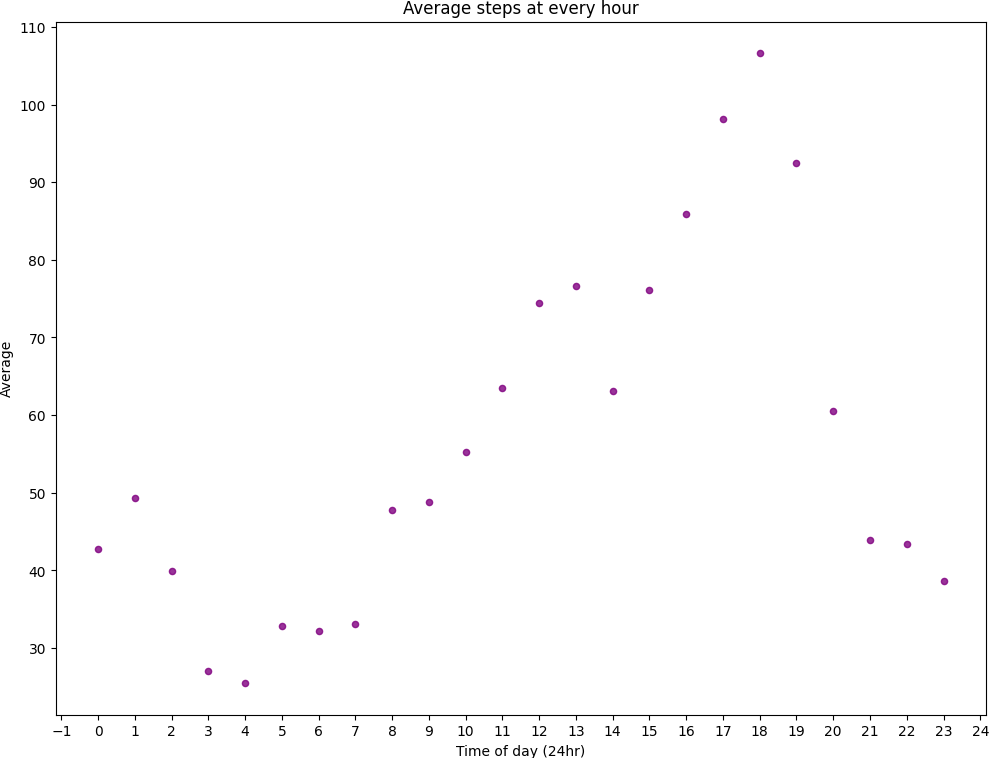
There is a small bump in averages from 00-03 AM as I tend to be a bit active right before I sleep. But since it is only a bit of activity, the step count is not as high just like one from 21 PM - 00 AM.
As I wake up, the graph shows a trend that I take increasingly more steps till 7 PM. With the highest average at 6-7 PM ~110 steps. High frequency during the evening 5-8 PM most likely represents the evening walks for food, return from classes, etc.
Average steps on a day over months
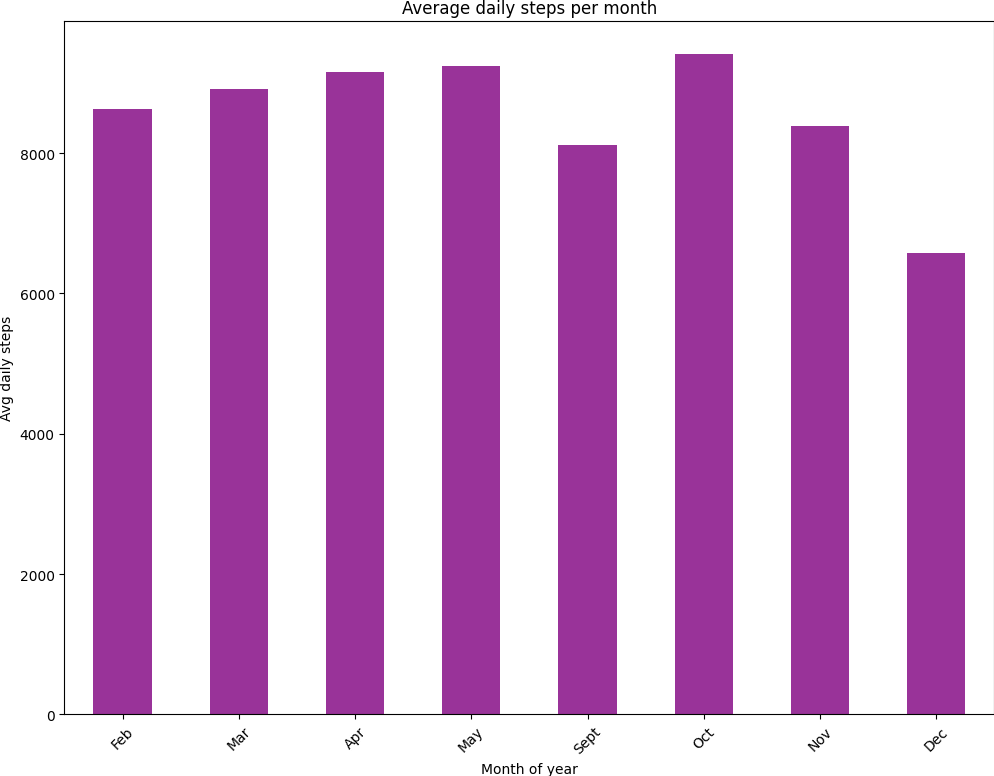
While most of the averages are consistent, there is a dip in December 2020. Most likely this represents low outings as the weather got colder in Texas.
Average steps over days of the week
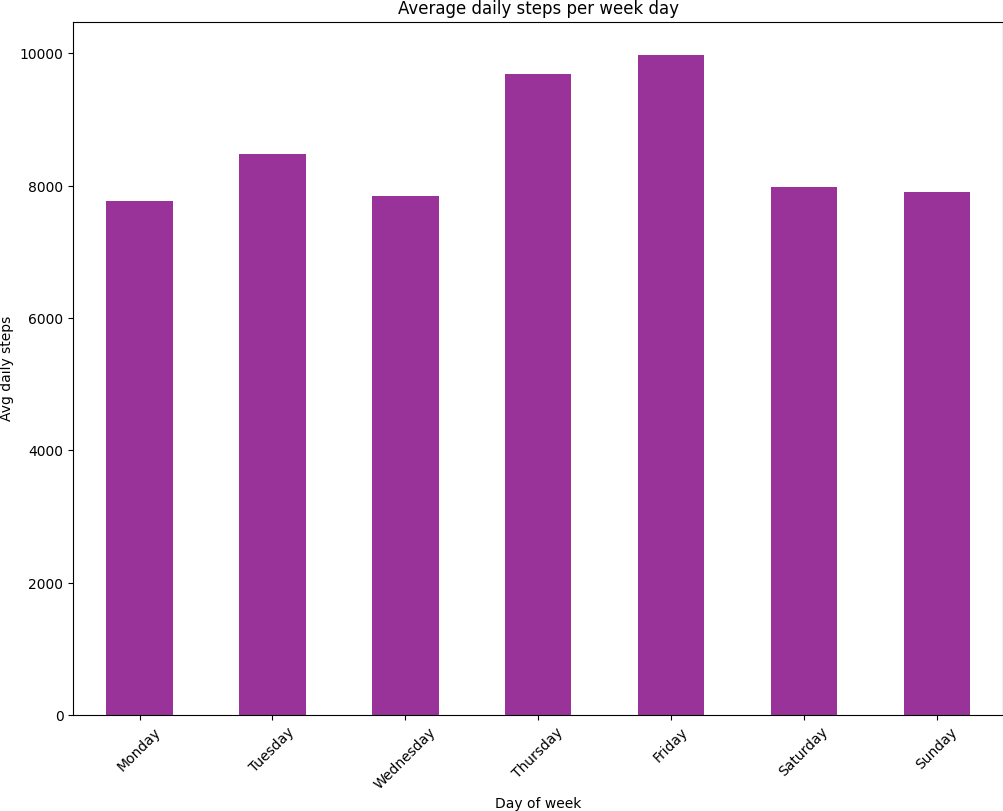
Average steps overall on a day are 8526.37.
While most of the averages are consistent, there is a bump on Thursday and Friday. This bump most likely represents the walks for senior design lab, return from classes, dinner, etc. which were more frequent on these two days compared to the rest.